There's a heat dome forecast to settle into the upper Midwest tomorrow that will hang around for the next week. Temperatures are expected to be 85F degrees and higher with lows dipping only into the 70s at night. This will be the warmest the summer of 2024 has been so far. Compared to the last two hot and dry summers, this summer has been very wet and relatively cold. I've warn a long sleeve shirt on morning walks and bike rides more this year that I can remember in the past handful of years. According to the ACIS there has only been one day of 90F+ all year which is much lower than we've experienced in the past five years.
Number of Days above 90°F since 2020
| Year | Number of Days ≥90°F | Missing Count |
|---|---|---|
| 2020 | 15 | 0 |
| 2021 | 26 | 0 |
| 2022 | 15 | 0 |
| 2023 | 25 | 0 |
| 2024 | 1 | 38 |
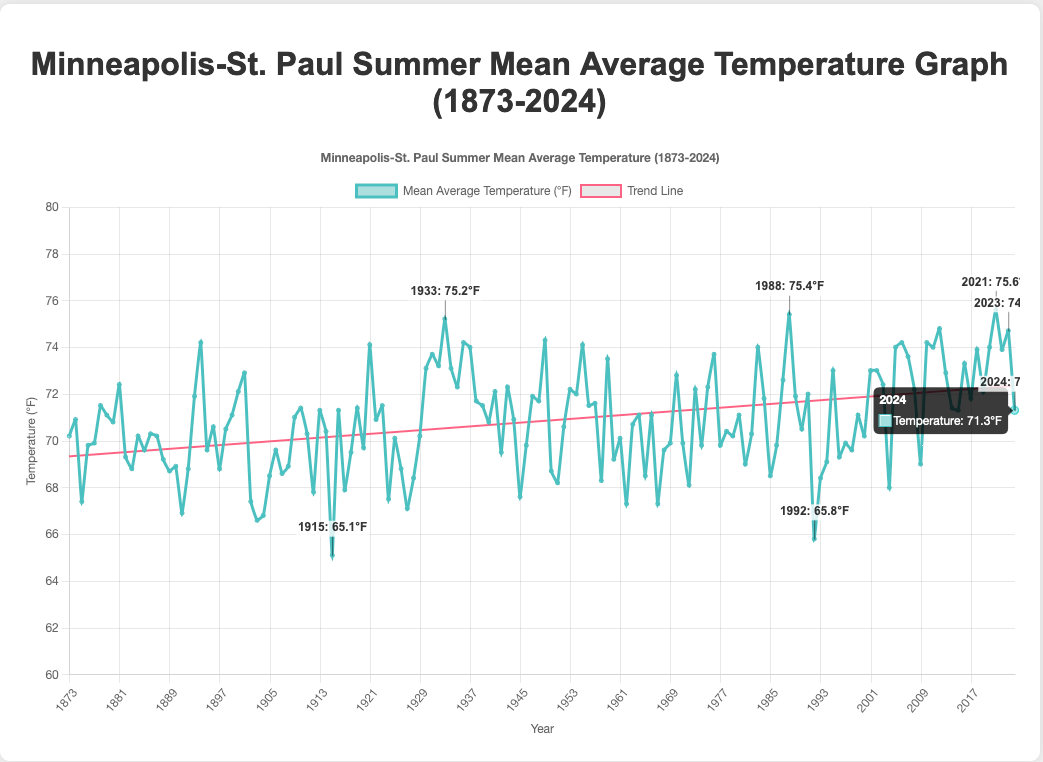
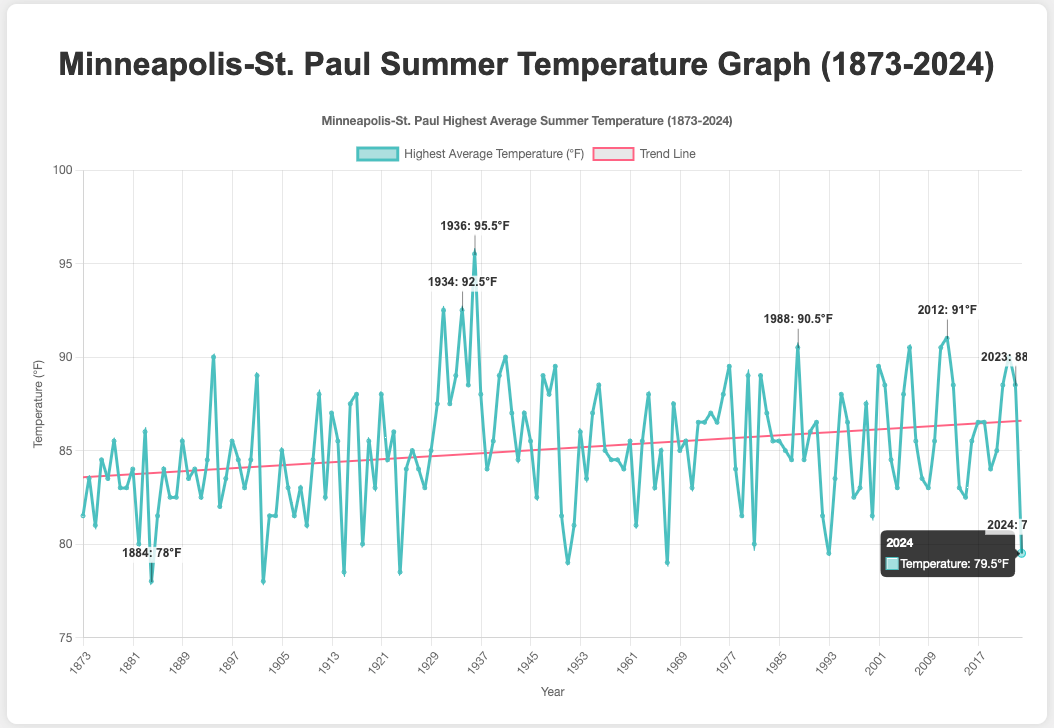
With the upcoming heat, I wanted to run a quick query to see where this summer has been compared to previous years for the average high temperature and average temperatures. The difference is that the average high temperature only takes into account the high temperature for the day. The average temperature takes into account the high and the low for the day.
Minneapolis St. Paul Average Temperature Graph Summer 2024
Minneapolis St. Paul Average Daily High Temperature Graph Summer 2024
It's going to be really interesting to see where the data sits after this heat wave pushes through.