It's going to be in the 80s this week which is ten degrees above normal for this time of year in Minnesota. I'm seeing a trend recently where September in Minneapolis just feels like an extension of August. I don't remember it always being this way, so I ran a ACIS query to find out if this is a new trend or if it's been going on for a while. The query, visualization and data set below is for the average Minneapolis temperature (combination of high and low temps) for September from the beginning of records until today (2024).
Minneapolis September Mean Average Temperature (1873-2024)
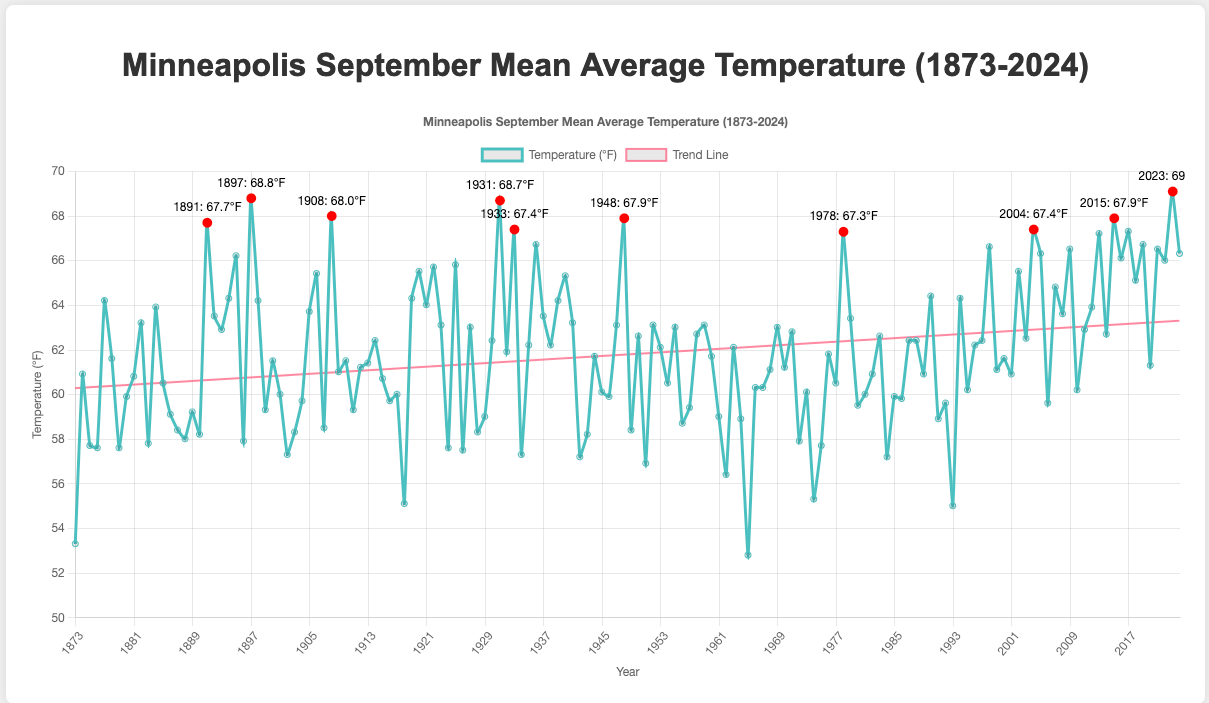
Here are some observations I have that came out of this data:
- The warmest September on record occurred last year in 2023. Will this year be hotter?
- 4 out of the top 10 warmest Septembers have occurred since 2000.
- The list includes years from various decades, showing that these warm Septembers are not totally uncommon, but the frequency of them lately has definitely caught my attention.
- The 19th century and early 20th century is represented in this list, which also shows that some historical Septembers were exceptionally warm. Although, not the bunching that we're seeing lately.
The biggest thing that this data shows me is that there is a general warming trend, particularly in the most recent years starting around 2000. Also highlighting that warm Septembers have occurred sporadically throughout the entire period of record. There were some bunching at the beginning of the century and then in the 1930s (the 1930s were exceptionally hot) then a "cool" period for a while until 2000 when things started to bunch and trend upwards.
Here are some other of my observations from looking at this data including the top 10 warmest Minneapolis Septembers on record.
Top 10 Warmest Septembers In Minneapolis:
- 2023: 69.1°F
- 1897: 68.8°F
- 1931: 68.7°F
- 1908: 68.0°F
- 2015: 67.9°F
- 1948: 67.9°F
- 1891: 67.7°F
- 2013: 67.2°F
- 1936: 66.7°F
- 2019: 66.7°F
Temperature Range
- Lowest: 52.8°F (1965)
- Highest: 69.1°F (2023)
- Overall range: 16.3°F
Early Period vs. Recent Period:
- Average temp (1873-1900): 60.8°F
- Average temp (1997-2024): 64.6°F
- Difference: 3.8°F increase
Variability:
- The average temperature fluctuates significantly from year-to-year throughout the data. So one year can be very warm followed by a very cold year. I think this follows what a lot of scientists are saying.
- No clear trend in variability (i.e., recent years don't show noticeably more or less variability than earlier years.
Conclusions
September has been warmer recently than in the past. The data strongly suggests a warming trend in Minneapolis' September temperatures over the past 151 years. This trend has accelerated in recent decades. However, significant year-to-year variability remains a consistent feature throughout the entire period.
This local trend follows with the broader global climate change observations from scientists around the world. You'd need a real scientist and further analysis to attribute these changes to specific causes or to predict future trends.
You can view more weather data on Today's Record High, my website where I track the record high, low and normal temperatures from major weather stations around the country.